
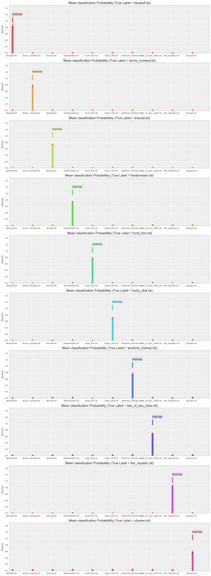
For each word, we take the topic that maximizes the conditional distribution for each word. Thereafter, we can
nd the document with the most similar topic distribution simply by computing the frobenius norm. We repeat the above steps several times so that we can have means and standard deviations for our predictions. Since we may have different votes per iteration, we choose the mode of the prediction for each book. The figure below illustrates the probability for classification of each label for each of the test documents.
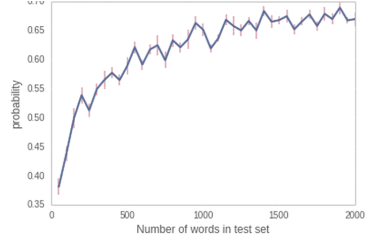
We calculate the predictive probability for test documents of different lengths. For each length, we start the test document at 30 different random points in order to get a mean prediction probability and a standard deviation. The figure below is a plot of the predictive probability against the length of the test set. We can see a logarithmic evolution of the probability against the number of words in the test set.
