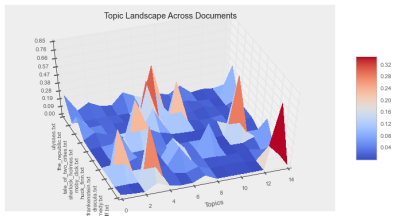
We calculate each train document's topic distribution. We then verify that each document has a unique topic distribution signature, allowing for classification. The visualizations below also illustrate that we observe few high-mass topics per document since we set our alpha parameter to a small number (.10)
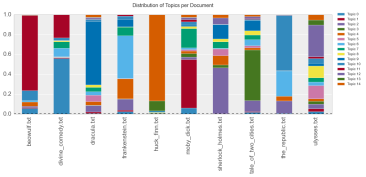
Each column represents each individual book and different colors represent different topics. As we can see, each different book has different topic distributions, which provides us the hint for prediction.
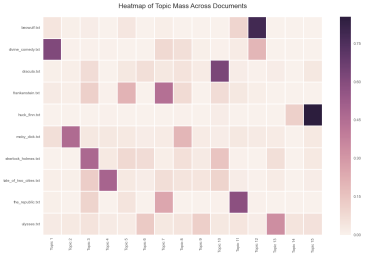
Similarly, here we have each column represents each document, and each column represent different topics. The darker the color, the higher density it is. We see each book has different density of topics.